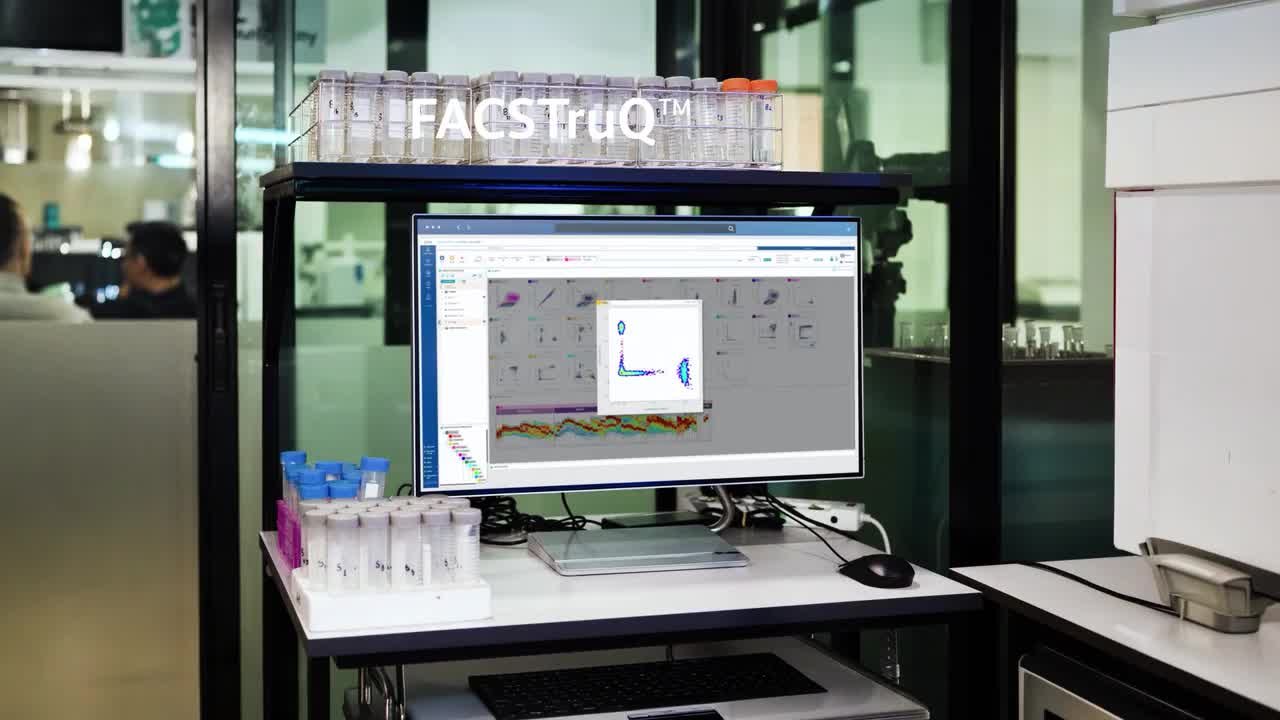
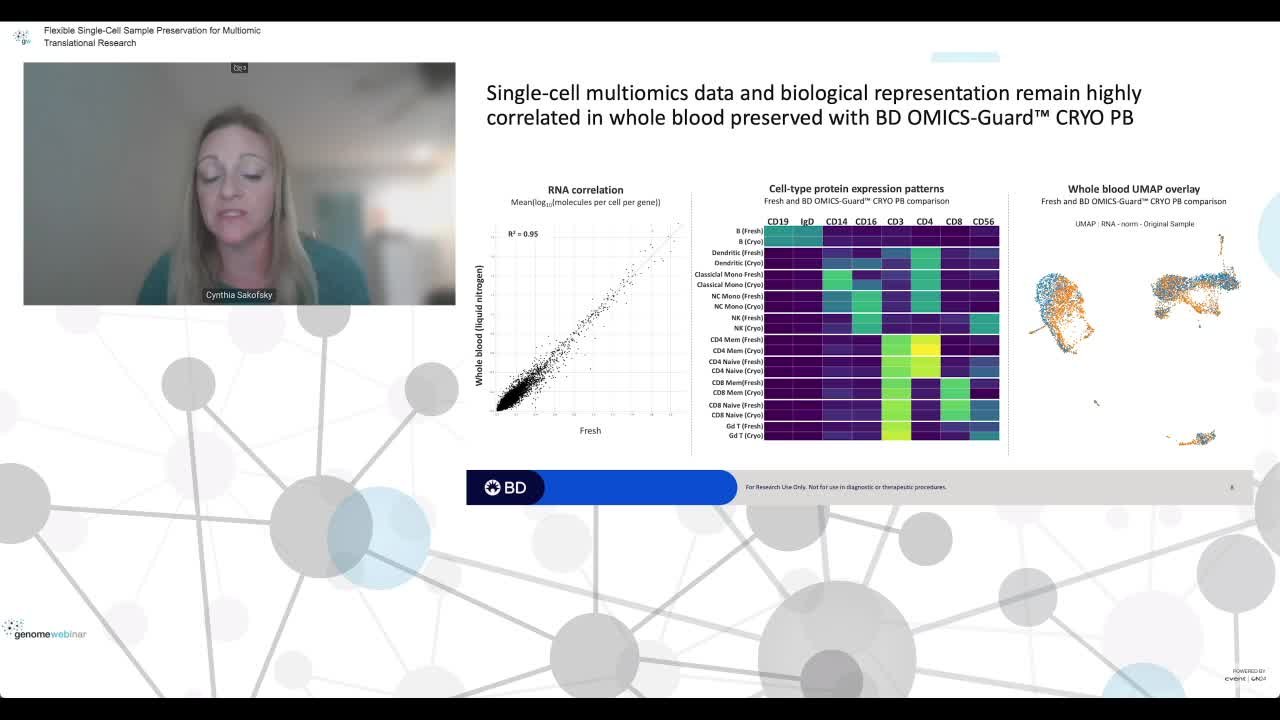
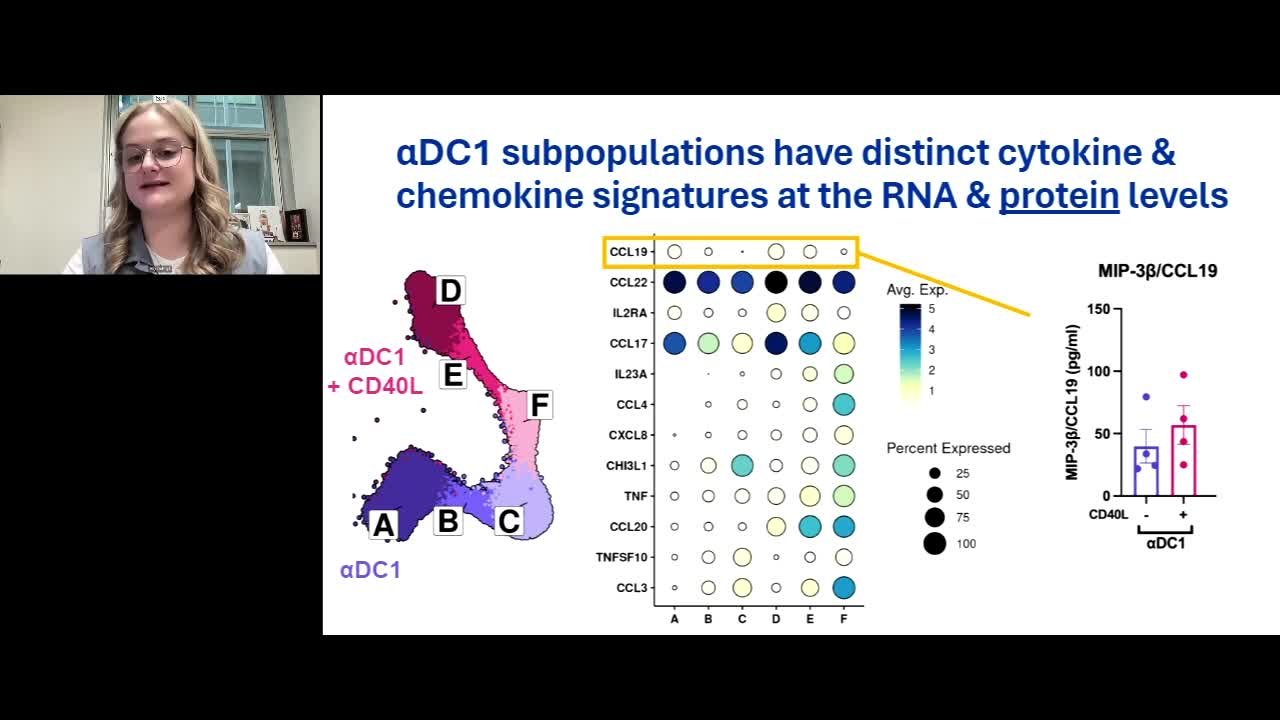
Use t-SNE and UMAP for dimensionality reduction. Customize graphs with adjustable dot size, opacity and color palettes. Save plots as SVG or PNG or add to the gallery. Export all graphs as PNG at the end of your analysis.
Currently loaded videos are 1 through 15 of 434 total videos.